


I saw a tweet from @Amazing_Maps which showed the traffic lights of Toronto. That post lead to the original post on Reddit. The original poster had used data from the City of Toronto's Open Data initiative to get the traffic light locations
Glasgow also has its own Open Data initiative and it has the traffic light data sets available ( you need to create a free login for this particular data set )
How i did this:
- Download the data set ( create a free login for this data set )
- ( NB types of crossing include : intersection, pelican, toucan, puffin and wig wag :) )
- Uh oh it is in Easting and Northing Format for locations and an excel file.
- Lets fix that ; Tool to use Grid Reference Finder Batch Convert
- Change to csv: read the file into any handy spread sheet and dump a csv file ( ssconvert works well for what i wanted )
- On Gridreferencefinder page fill in as requested; Paste csv file, From Format is XY location; Columns are 4 and 5
- Press Convert and for simplicity i did an "Export points to Google Earth ( KML ) File", ( i originally made a new csv file with the lat long columns and added a new column name line for more control
- If you have any sort of Google account you have access to Fusion Tables. Select "Create a Fusion Table" and select the kml file just created. Then "Next >>"; "Next >>" ; "Finish"
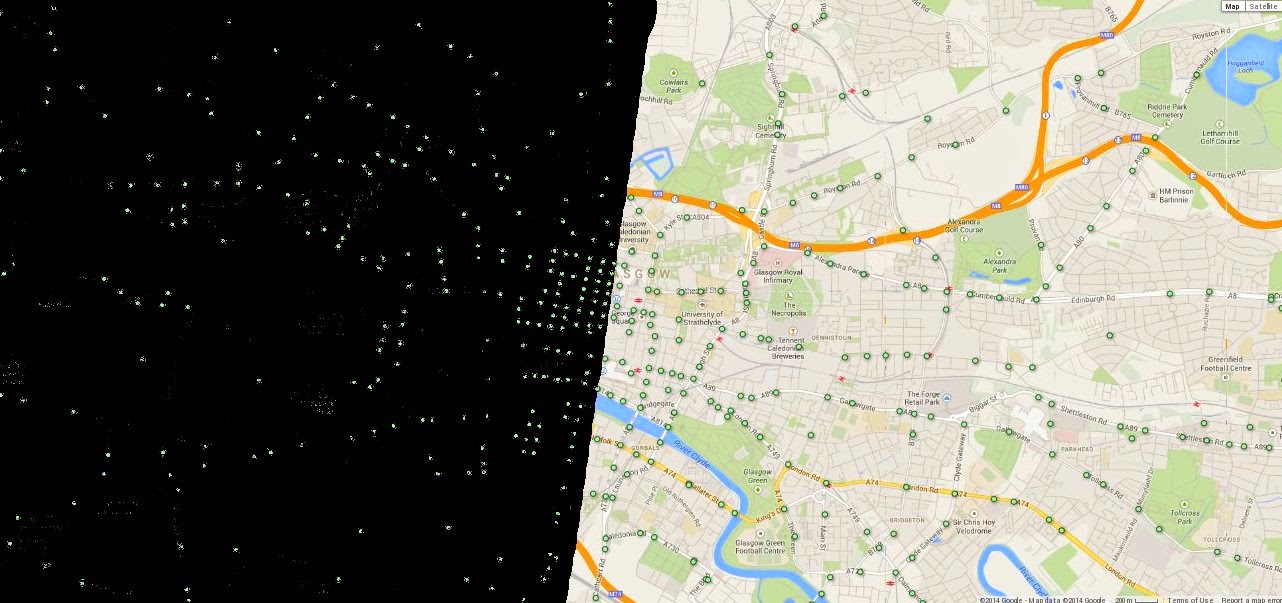
- Pick "Map of Geometry" you can see the points overlaid on a map
- Change colour/shape of the markers as required. Take a screen shot
- Import in to your graphics program of choice and select by color for the marker color,then invert the selection and paint over the background. Tidy up and there is your image ( Could do layer differences as well but that didnt work as well)
Junction / Street Location,Site Type,Pedestrian Crossing Available,Eastings,Northings Argyle St/Stobcross St/North St/Newton St (Anderston X),Intersection,Yes,258009,665258 Broomielaw / North St / Newton St,Intersection,Yes,258007,664945 St Vincent St / North St /Newton St,Intersection,Yes,258001,665649 Bath St / North St / Berkeley St / Newton St,Intersection,Yes,257962,665922 etc etc


No comments:
Post a Comment